


Examining the Factors Affecting Safety Performance in Industries
Abstract
Implementing safety and health practices in the industry is paramount for maintaining uninterrupted and stable operations. Consequently, industries establish safety performance systems to monitor status and ensure the robustness of management and integrity of safety-related tasks. With insights into the significance of diverse factors for safety performance, companies can consider additional perspectives and prioritize key elements to seek continuous improvement in safety and health. The survey was designed after the Health and Safety (cultural) Diagnostic Tool (HSDT) developed by the United Kingdom Health and Safety Executive. Statistical assessment techniques, including one-way Analysis of Variance (ANOVA), Kruskal–Wallis test, and Dunn’s test, were employed to evaluate the importance and influence of various factors. The study reveals that the care level of employers holds the highest statistical importance in safety performance, with higher levels of care correlating with more favorable safety outcomes. Furthermore, the presence of in-house safety professionals significantly contributes to improved safety outcomes. Both experience with employers and experience in the safety and health field play essential roles in determining safety performance. Other notable factors influencing safety performance encompass the country and industrial category of operation, as well as safety and health credentials. Companies can incorporate these critical findings into their strategies for enhancing safety performance.
KEY WORDS: safety performance, statistical analysis, leading indicators
1. Introduction
Safety and health regulations have their origins in the 19th century. Remarkably, the Factories Act of 1833 in the United Kingdom aimed to prevent injuries among child workers. In the United States, the Safety Appliance Act of 1893 and the Federal Employers Liability Act of 1908 were significant milestones, establishing the first worker’s safety law and the first worker’s compensation law for railroad employees, respectively. In the latter part of the 19th century, companies in the United States, Canada, the United Kingdom, and other countries began appointing full-time occupational safety personnel to supervise and uphold safety standards (Ju, 2020). As legislation continued to advance and professional organizations emerged, societal norms regarding workplace safety evolved, and employers increasingly prioritized workplace safety and health to diminish fatalities, injuries, and illnesses (Provan et al., 2018).
The application of safety and health practices in organizations is widely acknowledged for maintaining stable operations, which yields cost-saving benefits and makes the industries eligible to pursue sustainability. Therefore, it is critical for industries to understand the critical factors for the safety and health field and corresponding safety performance indicators. Thus, industries could continuously improve safety and health conditions by monitoring and evaluating the ongoing safety performance.
However, a universally accepted definition of safety performance is absent in academic literature, as numerous authors put forth diverse performance indicators (Liu et al., 2014). Wu et al. (2008) considered safety performance as the effectiveness of a management system concerning occupational safety and health, while De Koster et al. (2011) defined it as the ability of businesses to prevent the occurrence of occupational injuries. Although, Arezes and Sérgio Miguel (2003) regarded good safety performance as maintaining a record void of workplace accidents and/or occupational illnesses and injuries over a prolonged timeframe. However, considering the characteristics of incidents that do not consistently occur over a given period of time, it demonstrates the limitation of this definition (Reiman & Pietikäinen, 2012).
To actively monitor safety performance, the conditions in safety management and the effectiveness of preventive actions in businesses are of concern. Therefore, the definitions of safety performance adopted in this study are: (a) a facility is highly performing if its management of safety is effective, and (b) management of safety is effective if it leads to the reduction or elimination of occupational injuries and illnesses in the short-term to medium-term (Tremblay and Badri, 2018).
In conventional practices, safety performance is evaluated using lagging indicators, such as days away, restricted, or transferred (DART) from work, and the total case incident rate (TCIR) from the United States Occupational Safety and Health Association (OSHA) (Sinelnikov et al., 2015). Lagging indicators for safety and health are the reactive indicators indicating the observations of accidents or unexpected events. Although the trend of safety performance could be evaluated by them, they offer limited useful information for identifying deficiencies in status in the organization. On the other hand, leading indicators offer preemptive insights into safety and health-related management and tasks, with the completeness of safety management system activities serving as an example in this category. Furthermore, evidence has shown that the application of leading indicators results in enhanced safety compliance and the adoption of preventive measures (Hallowell et al., 2013). Therefore, rather than depending on lagging indicators, as in the prior study, to deduce safety performance, this study emphasized assessing safety performance by utilizing leading indicators.
With appropriate definitions of safety performance, the factors influencing safety and health activities can be assessed. The primary objective of this study is to comprehensively analyze the multifaceted factors influencing safety performance within companies. By doing so, industries can effectively integrate these parameters into their pursuit of excellence in safety and health practices, thereby fostering a culture of safety and promoting the well-being of their employees.
2. Methods
In this study, data-driven methodology is implemented to determine significant factors on safety performance, as shown in Fig. 1. The data-driven technology encompasses three main stages: data collection, data analysis, and recommendations derived from the analysis findings. To gather data, an extensive investigation was conducted across companies spanning various industries and countries. Surveys were administered to employees within these organizations to ascertain their roles and gauge their perceptions of safety performance. Additionally, it’s important to highlight that the study obtained approval from the Institutional Review Board (IRB) and adhered to relevant guidelines. Statistical analysis was then conducted to assess the relationship between factors and the safety performance of the industrial facilities.

2.1 Survey Tool
This study utilized the Health and Safety (cultural) Diagnostic Tool (HSDT) from the United Kingdom Health and Safety Executive (HSE) to develop a questionnaire (Bell et al., 2011). The HSDT consists of six building blocks: commitment, worker engagement, prioritization of health and safety, compliance, measurement, and organizational learning, with five levels of options. The questions in the HSDT are the leading indicators for safety performance.
The survey consisted of two sections: the basic information and the safety performance scale. The basic information section covered queries about the respondent’s organization and personal details. The former encompassed geographic location, facility type, size, and safety department information. The latter included the respondent’s field of major, educational level, safety and health credential status, experience in the safety and health profession, and tenure with their current employer. On the other hand, the safety performance scale involves the following elements: (a) recognizing safety and health hazards; (b) measuring, evaluating, and controlling safety and health hazards; (c) safety and health training and management; (d) applying business principles, practices, and metrics in safety and health practices; and (e) applying industrial safety and health laws and regulations (Chang et al., 2012).
Workers were given surveys to ascertain their roles within their organizations and gauge their perceptions of safety performance within their respective facilities. Furthermore, the survey was conducted using the Texas A&M University Qualtrics Survey platform, chosen for its adherence to stringent information security standards and essential quality control features.
2.2 Survey Design
The survey is designed to collect data in order to determine the impact of factors on safety performance. The questions for the survey are shown in Table 1. For the safety performance scale, each of the six safety performance questions is rated on a five-level scale, with numerical values assigned from 1 to 5 to denote low to high-performance levels. Subsequently, the average of these six questions, which is represented by HSDT_avg, is computed to represent overall safety performance.

2.3 Statistical Analysis
2.3.1 One-way Analysis of Variance (ANOVA)
Analysis of Variance (ANOVA) is a statistical method employed to compare variances among the means of various groups. ANOVA relies on several assumptions, including the normality of data within each group, homogeneity of variances across all groups, and independence of data points. Specifically, one-way ANOVA is utilized in single-factor experiments featuring k levels of treatments (or groups) to evaluate differences based on variances (Wu and Hamada, 2009).
The observed value y could be calculated as:
![]() , (1)
, (1)
where, ![]() is the jth observation with treatment i,
is the jth observation with treatment i, ![]() is overall mean,
is overall mean, ![]() is ith treatment effect,
is ith treatment effect, ![]() is the independent
is the independent ![]() with mean 0 and variance
with mean 0 and variance ![]() ,
, ![]() is the average of all N observations
is the average of all N observations ![]() , k is the number of treatments,
, k is the number of treatments, ![]() is the number of observations with treatment i, and
is the number of observations with treatment i, and ![]() is the mean of observations for the ith treatment.
is the mean of observations for the ith treatment.
Then, the treatment sum of squares (SSTr) and the error sum of square (SSE) are, respectively, as:
![]() , (2)
, (2)
![]() . (3)
. (3)
The ANOVA table for the one-way layout is shown in Table 2.

The F statistic is calculated to evaluate the significance level for the null hypothesis (![]() ), which shows that there is no difference between the treatment, is:
), which shows that there is no difference between the treatment, is:
![]() ,(4)
,(4)
 (5)
(5)
At last, the p-value is applied to demonstrate the likelihood of obtaining a result as extreme as or more extreme than the observed result, assuming the null hypothesis (![]() ) is true. As the p-value is less than the chosen level of significance, the results are deemed statistically significant and align with the alternative hypothesis (
) is true. As the p-value is less than the chosen level of significance, the results are deemed statistically significant and align with the alternative hypothesis (![]() ), suggesting that not all
), suggesting that not all ![]() are equal in this scenario. The level of significance applied in the study to judge the influences of factors is 0.05.
are equal in this scenario. The level of significance applied in the study to judge the influences of factors is 0.05.
2.3.2 Kruskal-Wallis Test (KW Test)
Alternatively, given the uncertainty surrounding the normality and homogeneity of variances in the data, it is recommended to employ nonparametric statistical analysis methods (Feir-Walsh and Toothaker, 1974). Kruskal and Wallis (1952) proposed a nonparametric variant of rank-based statistical analysis method as an alternative to one-way ANOVA (Nwobi and Akanno, 2021).
The Kruskal-Wallis Test (KW test) is a non-parametric statistical method employed to assess whether there exists statistically significant differences between the medians of independent groups. The null hypothesis for KW test is that all the medians of treatments are the same, and the H statistics are as follows:
![]()
 (6)
(6)
(7)
where, ![]() is the median of the treatment i,
is the median of the treatment i, ![]() , k is the number of treatments,
, k is the number of treatments, ![]() is the number of observations with treatment i,
is the number of observations with treatment i, ![]() is the rank of observation j from treatment i,
is the rank of observation j from treatment i, ![]() is the average rank of all observations in treatment i, and
is the average rank of all observations in treatment i, and ![]() is the average of all the
is the average of all the ![]() .
.
H follows an asymptotically chi-square (![]() ) distributed with
) distributed with ![]() degree of freedom, allowing for the calculation of the corresponding p-value. This enables the determination of whether statistically significant differences between treatments exist, based on the chosen level of significance.
degree of freedom, allowing for the calculation of the corresponding p-value. This enables the determination of whether statistically significant differences between treatments exist, based on the chosen level of significance.
2.3.3 Dunn’s Test
As the KW test rejects the null hypothesis, Dunn’s test is an appropriate test to conduct pairwise multiple comparisons to evaluate which pairs of groups show these differences (Dinno, 2015).
In the process of performing pairwise multiple comparisons, the likelihood of committing a Type I error rises. Dunn’s test mitigates this concern by modifying the p-value to manage the familywise error rate, ensuring the maintenance of an overarching level of significance (Dinno, 2015; Dunn, 1961; 1964). The formulas for z statistics are as follows:
![]() ,(8)
,(8)
![]()
 ,(9)
,(9)
where, I is one of the 1 to k multiple comparisons, ![]() ,
, ![]() ,
, ![]() is the sample size for ith treatment, and
is the sample size for ith treatment, and ![]() ,
, ![]() is the number of observations tied at the sth specific tied value.
is the number of observations tied at the sth specific tied value.
3. Results
To examine the impact of factors on safety performance for companies. The hypothesis suggests that there are some factors that could influence the safety performance of companies. From a statistical perspective, the null hypothesis is that the existence of the factors does not influence the safety performance, and, thus, statistical methods were employed to investigate it. As the null hypothesis is rejected, it implies the alternative hypothesis, which means the factor does impact the safety performance. Then, further post hoc analysis would be conducted to discover more insights.
3.1 Data Collection
From December 14, 2022, to July 3, 2023, 2,195 responses were collected, as shown in Table 3. Because statistical analysis methods were applied to study differences from different groups, comprehensive responses, composed of 1,447 responses, were retained for further analysis.

3.1.1 Organizational Information
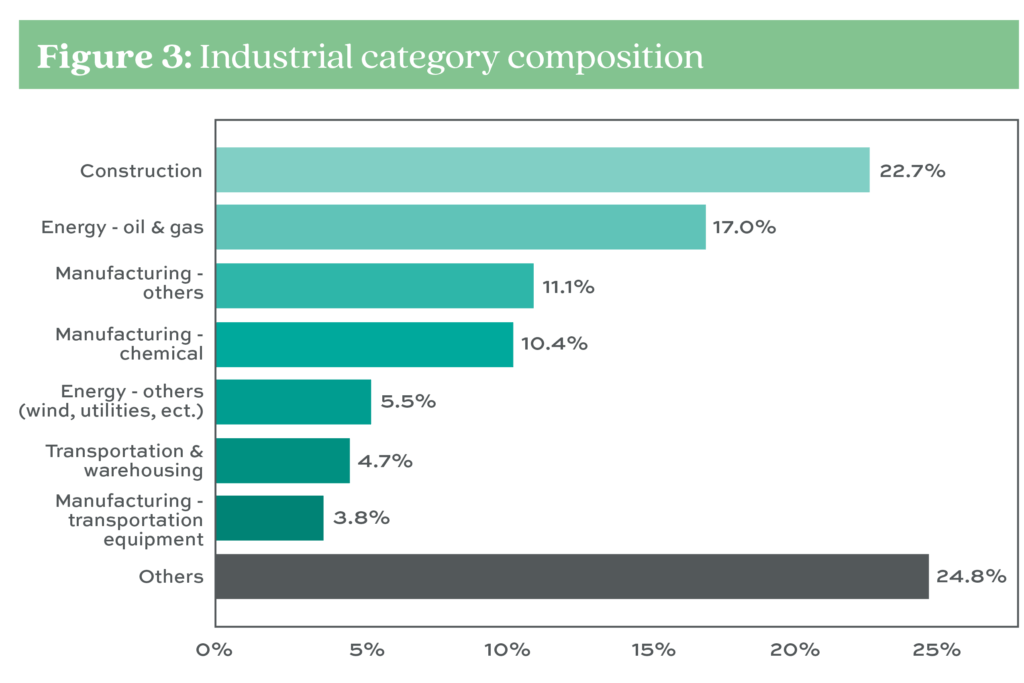
The composition of country and industrial categories of responses are displayed in Figs. 2 and 3, respectively. In terms of country distribution, most responses originate from the United States (63.7%), followed by Canada, China, Saudi Arabia, India, New Zealand, Nigeria, the United Kingdom, and others. Regarding industrial categories, the responses encompass the construction, energy, and manufacturing industries. The other organizational information results for the survey are in Table 4.

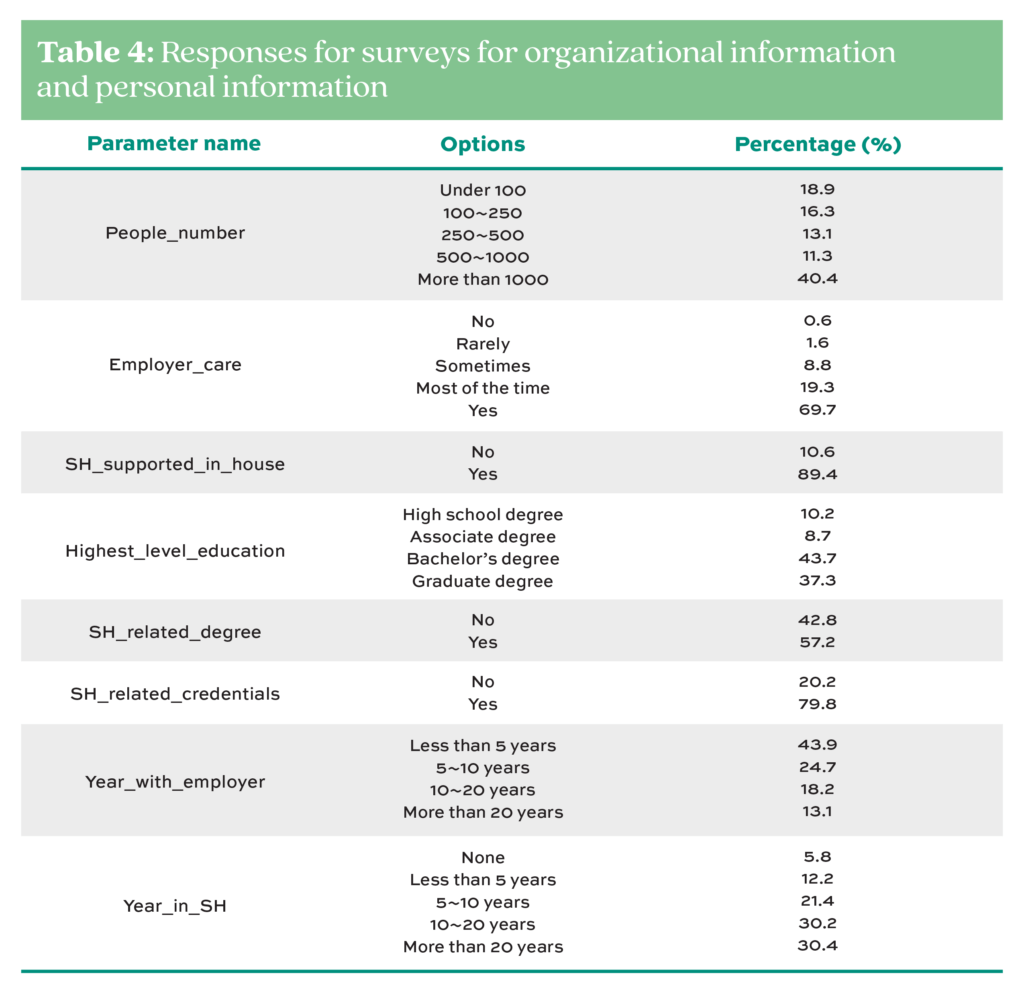
The survey indicates that the majority of employers prioritize personal safety and health (69.7%), with a significant portion of facilities employing in-house safety professionals (89.4%).
3.1.2 Personal Information
The survey’s findings regarding personal information are presented in Table 3. Most of the respondents hold a degree related to safety and health discipline (57.2%) and safety and health credentials (79.8%).
3.1.3 Safety Performance Scale
The average of the safety performance scale, HSDT_avg, is applied to represent the safety performance. The distribution of the data and fitted line representing normal distribution is shown in Fig. 4. According to the plot, the distributions of safety performance are left skewed, which means the assumption of normality is doubtful.

Furthermore, the assumption of homogeneity of variances across all groups is violated by statistics. To address this, a robust nonparametric analysis, the KW test, was introduced alongside one-way ANOVA to assess the influence of diverse factors.
3.2 Statistical Analysis of the Difference Among Groups
3.2.1 Preliminary Analysis
The average of all safety performance scales was calculated to represent the value of the safety performance for each response. Hence, safety performance is categorized on a value from 1 to 5, indicating levels from low to high safety performance. This section employed one-way ANOVA and the KW test, utilizing safety performance as observations and factors as groups to examine whether collected organizational information or personal information significantly affects safety performance. The results from one-way ANOVA and the KW test are shown in Table 5.
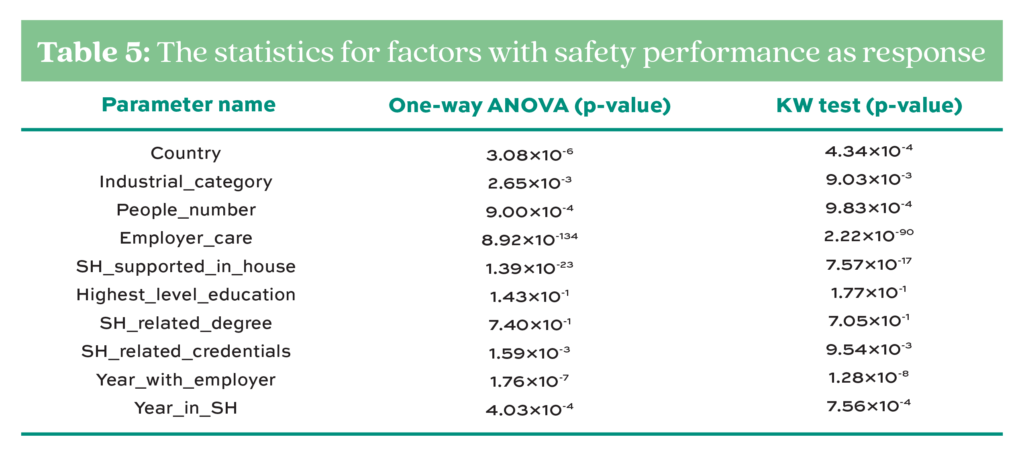
As the p-value is smaller than 0.05, it indicates that the data demonstrates the statistical significance of differences between the groups, so the null hypothesis is rejected based on the 0.05 significance level, and the alternative hypothesis is the implication from the study.
According to the p-values (Table 5), it can be deduced that almost all the organizational and personal parameters significantly affect safety performance, except for the highest level of education and holding a degree in a safety and health discipline.
Subsequent post hoc analyses were conducted to pinpoint the specific differences between groups for those parameters that showed statistical significance, further elucidating the impact of various factors on safety performance.
3.2.2 Post-Hoc Analysis
To further explore the nuances among groups exhibiting statistical differences, post hoc analysis was conducted for factors with more than two distinct groups. Dunn’s test was utilized to identify specific pairings that demonstrated statistical differences at the 0.05 significance level. The eligible factors in this analysis were People_number, Employer_care, Year_with_employer, and Year_in_SH, with detailed results presented in Table 6.

Due to the large number of countries involved, subsequent analyses in this section focus on the eight countries with the highest responses: United States, Canada, China, Saudi Arabia, India, New Zealand, Nigeria, and the United Kingdom. Similarly, the industrial categories selected for further analysis consist of the seven categories with the highest responses: construction, energy – oil and gas, manufacturing – others, manufacturing – chemical, energy – others, transportation & warehousing, and manufacturing – transportation equipment.
According to Table 6, the analysis revealed significant geographical variations in safety performance. Specifically, responses from the United States, Canada, and Saudi Arabia showed notable differences when compared to those from New Zealand and Nigeria. Additionally, a significant disparity was observed between the United Kingdom with New Zealand and Nigeria, and Saudi Arabia with India.
In terms of industrial categories, distinct differences were identified between certain sectors. The construction, oil and gas, and chemical manufacturing sectors exhibited significant variations in safety performance compared to other manufacturing, transportation and warehousing, and transportation equipment manufacturing industries. Besides, other energy industries bear statistical differences with the transportation and warehousing industry.
Regarding the number of people at the facility, only “More than 1,000 vs. 500~1,000” shows a statistical difference with other groups at the 0.05 significance level, as shown in Table 6. Considering the care level of the employer, “Yes” is different with others, and “Most of the time” is distinct from “Sometimes” and “Rarely.” As for the years of experience with the employer, “Less than 5” is unique compared to others, while the pair of “Less than 5” and “More than 20” also demonstrates the significant difference. Finally, in terms of years of experience in the safety and health field, “More than 20 vs. 5~10,” “More than 20 vs. Less than 5,” “More than 20 vs. None,” “10~20 vs. None,” and “5~10 vs None” possess the difference.
With the statistics acquired in the sections, the explanation from the survey could be discussed to obtain the implications of the results.
4. Discussion
4.1 Country and Industrial Category
Given the complexity of the categories for country and industrial sectors, this discussion is segmented to address each distinctly. The average safety performance scale scores for each country and industrial category are depicted in Figs. 5 and 6, respectively.
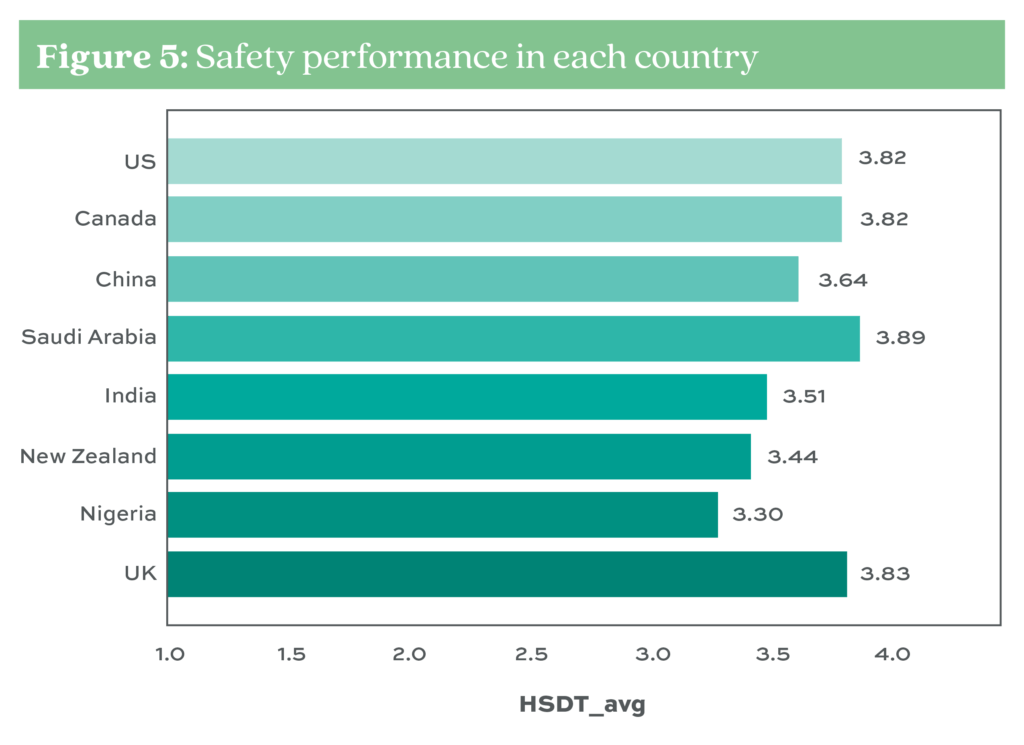

According to Fig. 5, Saudi Arabia holds the best safety performance among the countries studied. Furthermore, the combination of Dunn’s test (Table 5) and the safety performance implies that the United States, Canada, and Saudi Arabia have statistically higher safety performance than New Zealand and Nigeria. Besides, the United Kingdom demonstrates enhanced safety performance compared to New Zealand and Nigeria. Furthermore, Saudi Arabia holds a higher safety performance than India.
In terms of the industrial category, Fig. 6 highlights the chemical manufacturing industry as the leader in safety performance. The integration of Dunn’s (Table 5) and the safety performance suggests that the construction, oil and gas energy, and chemical manufacturing sectors statistically surpass other manufacturing sectors, i.e., transportation and warehousing, and transportation equipment manufacturing industries, in safety performance. Moreover, other energy industries also secure better safety performance than the transportation and warehousing industry.
4.2 Other Parameters
Beyond the country and industrial categories, Table 5 reveals that several other factors exhibit statistically significant differences in safety performance. These include the number of people at the facility, the level of employer care, the presence of in-house safety professionals, credentials related to safety and health, and years of experience both with the employer and in the safety and health field. Therefore, further studies are conducted on them. The inferences for the statistical difference between pairs are built on the Dunn’s test (Table 6), as well.
The levels for each parameter are represented as 1 to 5. The lower number stands for the lower value on the parameter. For example, 0 in-house safety professionals represents “No” in-house safety professionals, while 1 symbolizes “Yes” in-house safety professionals. Then, the lower number in the parameter related to experiences depicts the lower level of experience.
The corresponding average of safety performance on other organizational information, except for the country and industrial categories and personal information, is displayed in scatter plots with error bars based on a 95% confidence interval (Fig. 7).

Regarding facility size, a statistically higher safety performance was observed for facilities with more than 1,000 people compared to others. However, there is no increasing pattern for number of people and safety performance, which can be observed from (a) in Fig. 7, suggesting that the relationship between facility size and safety performance remains inconclusive within this study.
With the aspect on care level from employers, the safety performance of “Yes” is statistically better than that of others; additionally, the safety performance of “Most of the time” is better than that of “Sometimes” and “Rarely.” With the trend from (b) in Fig. 7, it could be concluded that higher levels of employer engagement correlate with improved safety outcomes. This finding underscores the critical role of employer involvement in safety and health initiatives, aligning with previous research that highlights the importance of top management’s commitment to safety practices (CCPS, 2018; Ndjoulou et al., 2015; T.C. Wu et al., 2010). Collaborative efforts with top-level executives are crucial in advocating for and improving overall safety performance within the organization.
The data, as illustrated in (c) in Fig. 7, clearly indicate that the presence of in-house safety professionals correlates with enhanced safety performance when compared to organizations without such professionals. This supports the findings from Cameron et al. (2007) and IOSH (2007), further reinforcing the idea that in-house safety professionals are instrumental in improving safety performance. Coordinating safety and health responsibilities requires effective interdepartmental communication. Internal safety experts, who are well acquainted with their organization’s culture, are uniquely positioned to collaborate with other experts and stakeholders, thereby developing widely accepted safety measures that contribute to overall operational efficiency.
Furthermore, the study highlights the importance of credentials related to safety and health. As shown in (f) in Fig. 7, the presence of such credentials is also a key factor in enhancing safety performance. This can be explained by the fact that safety and health-related credentials could serve as indicators of formal training and expertise, which play a vital role in elevating safety standards within organizations. This aligns with the research of Sawacha et al. (1999), which underscores the significance of training in safety performance.
Lastly, the study delves into the impact of experience, both with the employer and in the safety and health field. It reveals that individuals with fewer than 5 years of experience tend to have lower safety performance compared to their more experienced counterparts. Similarly, the absence of experience in the field is associated with poorer safety outcomes than possessing more than 5 years of experience; and less than 5 years and 5 to 10 years of experience performs worse compared to more than 20 years. These findings, as presented in (g) and (h) in Fig. 7, suggest that extensive experience within the employer’s environment and the safety and health field can be crucial for achieving higher safety performance. This observation is supported by Mohammadi et al. (2018), who noted that more experienced and educated workers tend to exhibit higher safety performance. However, the direct correlation with higher education was not strongly supported in this study.
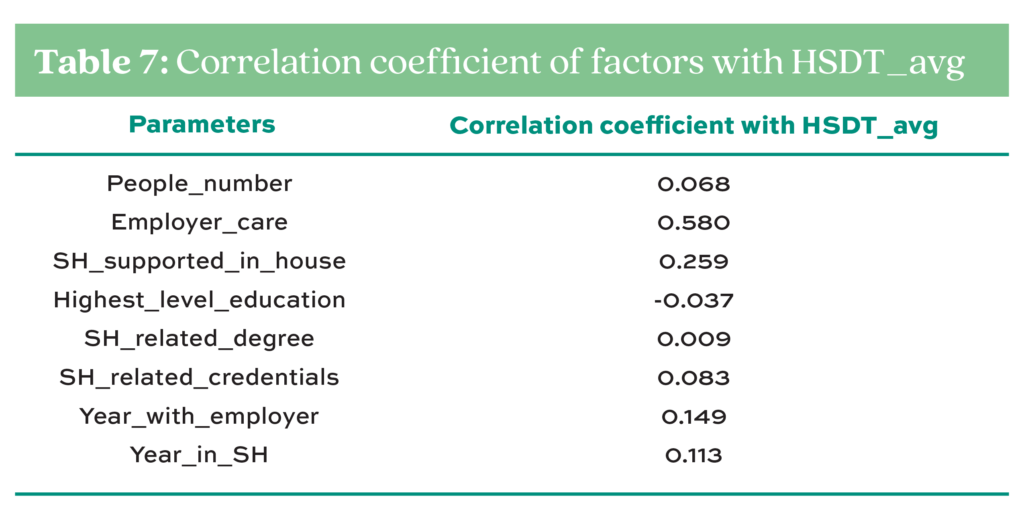
Additionally, the correlation coefficients between safety performances with each factor are shown in Table 7. The care level from employers has the highest correlation coefficient, followed by in-house safety professionals, experiences with employers, and experience in the safety and health field.
4.3 Limitations
The survey predominantly relies on data sourced from North America and Asia (Fig. 8), and as a result, there is a limitation in the representation of diverse cultures. Due to the comparatively lower number of responses from other continents, the survey might not adequately encompass the richness and variety of global cultures. To enhance comprehension of cultural diversity, future surveys should gather additional data from other continents to broaden their scope. Such a broader perspective would offer a more inclusive and comprehensive understanding of the diverse cultures and societies worldwide.

Furthermore, the assessment of safety performance in the study relies on subjective responses provided by participants (Table 1). Despite various strategies to mitigate acquiescence bias being applied, there remains a possibility that respondents may demonstrate a propensity to agree or respond positively irrespective of the question’s substance or purpose (Kuru & Pasek, 2016). Therefore, future research efforts could enhance subjective responses with objective measures to comprehensively evaluate the safety performance of the company.
Furthermore, the study’s conclusions are primarily derived from analyses that treat each factor independently in relation to safety performance. This approach may overlook potential interdependencies between parameters, where certain factors may not directly influence safety performance but rather interact with other variables to do so. Therefore, future research could benefit from a more nuanced analysis that considers these potential interrelations, possibly through more sophisticated statistical methods or larger datasets.
5. Conclusions
This study conducted surveys among workers in diverse industrial facilities across the world to ascertain their roles within their organizations and to assess their perceptions of workplace safety performance. Subsequently, statistical analysis was performed on 1,447 valid responses to investigate the correlation between each factor and safety performance in these facilities. The analysis identified several organizational and personal factors that significantly impact safety performance at a 0.05 significance level. Accordingly, the country and industrial category of operation, employer care, in-house safety professionals, safety and health credentials, and experience in the safety and health field emerged as significant factors influencing safety performance:
- Among the countries surveyed, the United States, Canada, Saudi Arabia, and the United Kingdom exhibit statistically higher safety performance.
- Within industries, the construction, oil and gas energy, and chemical manufacturing industries demonstrate significantly higher safety performance; meanwhile the chemical manufacturing industry holds the most robust safety performance.
- Employer care exerts a highly positive influence on safety performance. These results align with existing knowledge regarding the implementation of safety and health management in industries, highlighting the significance of seeking for acknowledgment, dedication, and engagement from top-level executives to effectively foster safety initiatives within the organization.
- Appointing in-house safety professionals within facilities yields significant and highly favorable outcomes for safety performance. Leveraging in-house safety professionals enables industries to develop appropriate and acceptable safety measures that can be implemented throughout the organization, resulting in enhanced efficiency.
- Safety and health-related credentials have a substantial and positive impact on safety performance. Therefore, investing in these credentials can effectively enhance safety performance across industries.
- Lastly, safety performance is contingent on both experience with the employer and experience in the safety and health field.
References
Arezes, P.M. and Sérgio Miguel, A., The Role of Safety Culture in Safety Performance Measurement, Measur. Busin. Excell., vol. 7(4), pp. 20–28, 2003. DOI: https://doi.org/10.1108/13683040310509287
Bell, N., Hopkinson, J., Bennett, V., and Webster, J., Development of a Web-based Leadership and Worker Engagement (LWE) Toolkit for Small and Medium Enterprises in Construction (RR880), https://www.hse.gov.uk/Research/rrhtm/rr880.htm, 2011.
Cameron, I., Hare, B., and Duff, R., PDF file, Superior safety performance OSH personnel and safety performance in construction, www.iosh.co.uk/researchanddevelopmentfund, 2007.
Center for Chemical Process Safety,PDF file, The Business Case for PROCESS SAFETY, https://www.aiche.org/ccps/business-case-process-safety-pdf, 2018.
Chang, S.H., Chen, D.F., and Wu, T.C.,eveloping a Competency Model for Safety Professionals: Correlations Between Competency and Safety Functions, J. of Safety Research, vol. 43(5–6), pp.339–350, 2012. DOI: https://doi.org/10.1016/j.jsr.2012.10.009
De Koster, R.B.M., Stam, D., and Balk, B.M., Accidents Happen: The Influence of Safety-Specific Transformational Leadership, Safety Consciousness, and Hazard Reducing Systems on Warehouse Accidents, J. of Operat. Managem., vol. 29(7–8), pp. 753–765, 2011. DOI: https://doi.org/10.1016/j.jom.2011.06.005
Dinno, A., Nonparametric Pairwise Multiple Comparisons in Independent Groups using Dunn’s Test, The Stata J., vol. 15, no. 1, 2015.
Dunn, O.J., Multiple Comparisons Among Meansorg/terms Multiple Comparisons Among Means, Source: J. of the American Statist. Assoc. vol. 56, no. 293, 1961.
Dunn, O.J., Multiple Comparisons Using Rank Sums, vol. 6, no. 3, 1964.
Feir-Walsh, B.J. and Toothaker, L.E., An Empirical Comparison of the Anova F-Test, Normal Scores Test and Kruskal-Wallis Test Under Violation of Assumptions, 1974.
Hallowell, M.R., Hinze, J.W., Baud, K.C., and Wehle, A., Proactive Construction Safety Control: Measuring, Monitoring, and Responding to Safety Leading Indicators, J. of Construc. Engineer. and Managem., vol. 139(10). DOI: https://doi.org/10.1061/(asce)co.1943-7862.0000730
IOSH, The Impact of Expert Health and Safety Advice, accessed from www.iosh.co.uk/safetyperform, 2007
Ju, C., Work Motivation of Safety Professionals: A Person-Centered Approach, Safety Science, vol. 127, 2020. DOI: https://doi.org/10.1016/j.ssci.2020.104697
Kruskal, W.H. and Wallis, W.A. Use of Ranks in One-Criterion Variance Analysis, Source: J. of the American Statist. Assoc., vol. 47, no. 260, 1952.
Kuru, O. and Pasek, J., Improving Social Media Measurement in Surveys: Avoiding Acquiescence Bias in Facebook Research, Comp. in Human Behavior, vol. 57, pp. 82–92, 2016. DOI: https://doi.org/10.1016/j.chb.2015.12.008
Liu, Y.J., Chen, J.L., Cheng, S.Y., Hsu, M.T., and Wang, C.H., Evaluation of Safety Performance in Process Industries, Proc. Safety Progress, vol. 33(2), pp. 166–171, 2014. DOI: https://doi.org/10.1002/prs.11644
Mohammadi, A., Tavakolan, M., and0 Khosravi, Y., Factors Influencing Safety Performance on Construction Projects: A Review, Safety Science, vol. 109, pp. 382–397, 2018. DOI: https://doi.org/10.1016/j.ssci.2018.06.017
Ndjoulou, F., Desmarais, L., and Pérusse, M., Employer Responsibility for Occupational Health and Safety: Challenges, Issues and Approaches, J. of Managem. Policies and Practices, vol. 3(1). DOI: https://doi.org/10.15640/jmpp.v3n1a1
Nwobi, F.N. and Akanno, F.C., Power Comparison of ANOVA and Kruskal–Wallis Tests when Error Assumptions are Violated, Metodoloski Zvezki, vol. 18(2), pp. 53–71, 2021. DOI: https://doi.org/10.51936/LTGT2135
Provan, D.J., Dekker, S.W.A., and Rae, A.J., Benefactor or Burden: Exploring the Professional Identity of Safety Professionals, J. of Safety Research, vol. 66, pp. 21–32, 2018. DOI: https://doi.org/10.1016/j.jsr.2018.05.005
Reiman, T. and Pietikäinen, E., Leading Indicators of System Safety – Monitoring and Driving the Organizational Safety Potential, Safety Science, vol. 50(10), pp. 1,993–2,000, 2012. DOI: https://doi.org/10.1016/j.ssci.2011.07.015
Sawacha, E., Naoum, S., andFong, D., Factors Affecting Safety Performance on Construction Sites, 1999.
Sinelnikov, S., Inouye, J., and Kerper, S., Using Leading Indicators to Measure Occupational Health and Safety Performance, Safety Science, vol. 72, pp. 240–248, 2015. DOI: https://doi.org/10.1016/j.ssci.2014.09.010
Tremblay, A. and Badri, A., Assessment of Occupational Health and Safety Performance Evaluation Tools: State of the Art and Challenges for Small and Medium-Sized Enterprises, Safety Science, vol. 101, pp. 260–267, 2018. DOI: https://doi.org/10.1016/j.ssci.2017.09.016
Wu, C.F.J. and Hamada, M.S., Experiments: planning, analysis, and optimization (2nd Edition), John Wiley & Sons, 2009.
Wu, T.C., Chen, C.H., and Li, C.C., A Correlation Among Safety Leadership, Safety Climate and Safety Performance, J. of Loss Preven. in the Proc. Indust., vol. 21(3), pp. 307–318, 2008. DOI: https://doi.org/10.1016/j.jlp.2007.11.001
Wu, T.C., Lin, C.H., and Shiau, S.Y., Predicting Safety Culture: The Roles of Employer, Operations Manager and Safety Professional, J. of Safety Resear., vol. 41(5), pp. 423–431, 2010. DOI: https://doi.org/10.1016/j.jsr.2010.06.006